

01
Context
At Zara, a Spanish global clothing company and part of the Inditex (ITX) group, I work in the Tech design team, specializing in Data and Power BI. I lead UX/UI projects, handling communication with stakeholders, conceptualizing interface solutions, and ensuring high-quality design implementation. I collaborate closely with data analysts and the tech team to translate complex data into intuitive interface solutions.
Role: UX Designer
Date: March 2023
Website: www.xtend.inditex.com
Goal
> Developed a style guide to integrate Zara’s design system with Power BI, ensuring visual consistency and improving workflow between design and development teams. Applied this style guide to all our products in the data department.
02
Problem Statement
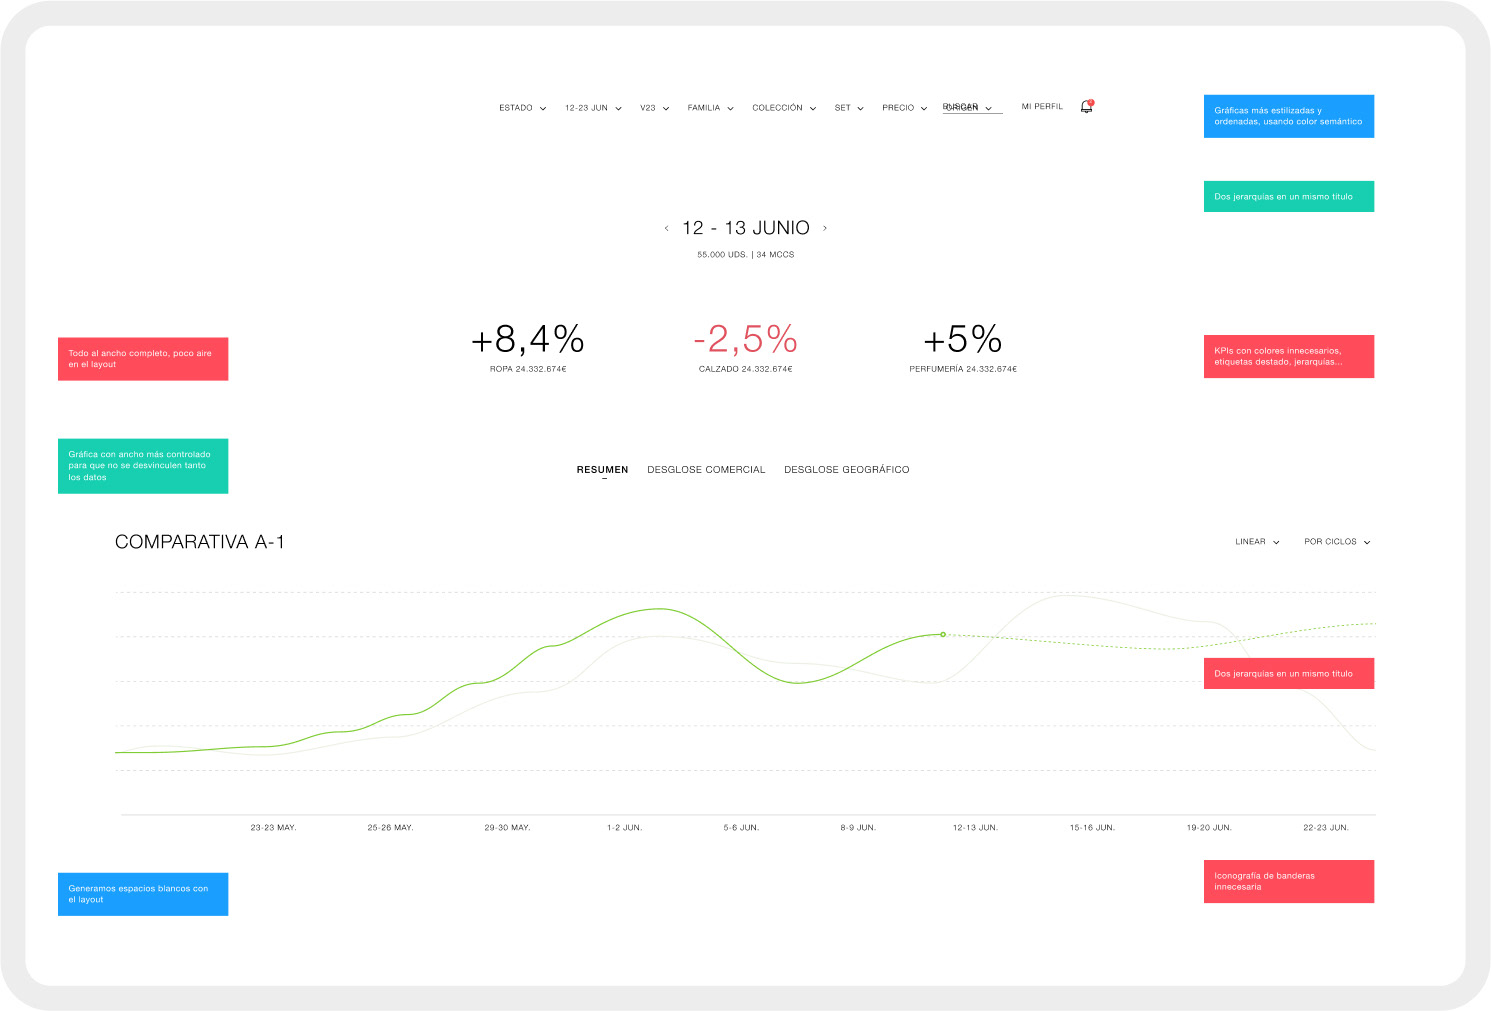
Background
At Zara's Data department, I noticed visual issues with our project on Power BI, which didn't align with the company's design system. I proposed and led the creation of a style guide that integrated the design system with Power BI, facilitating better collaboration between design and development teams. After refining the idea, I developed a guide that ensured visual consistency across reports and dashboards, becoming the new standard and enhancing workflow efficiency.
Target Audience
Internal stakeholders: Business strategists.
03
Research

Methods
Conducted stakeholder interviews, performed a competitive analysis of industry standards, and reviewed existing design systems and Power BI constraints.
Key Findings
Identified major visual inconsistencies and usability issues when applying Zara’s design system to Power BI. Noted specific areas where design elements failed to translate well into Power BI.
04
Ideation
Brainstorming
Conducted brainstorming sessions with the tech and design team to explore potential solutions for integrating the design system with Power BI.
Sketches
Created initial sketches and low-fidelity wireframes to visualize how design elements could be adapted for Power BI.
Concepts
Explored multiple concepts for the style guide, considering different approaches to maintain consistency without compromising Power BI functionality.
05
Design
Wireframes
Developed mid to high-fidelity wireframes demonstrating how key components of the design system could be adapted for Power BI and used in our data products.
Prototypes
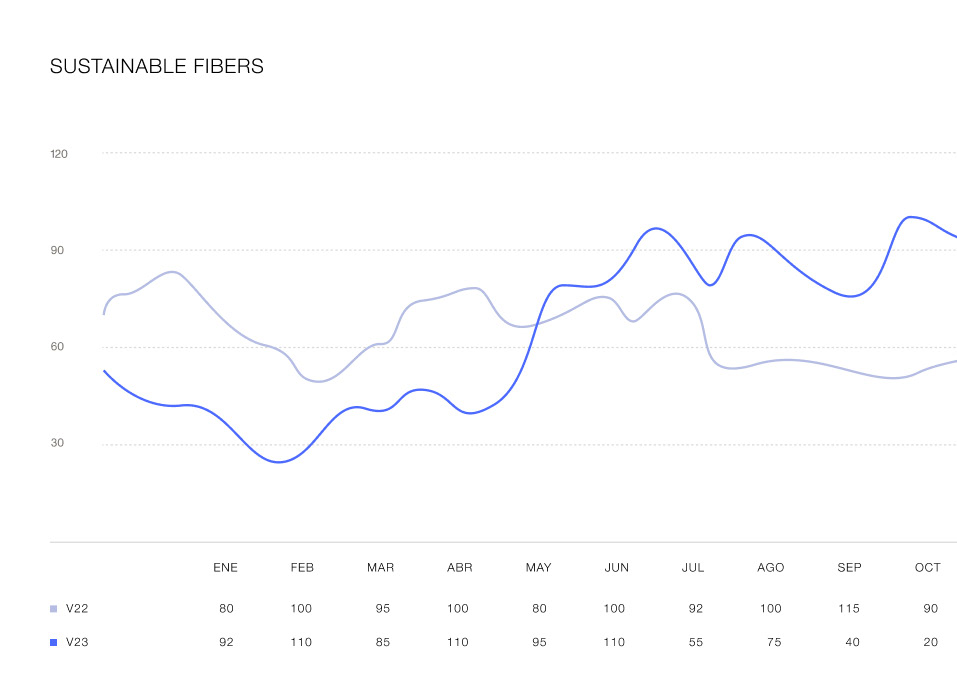
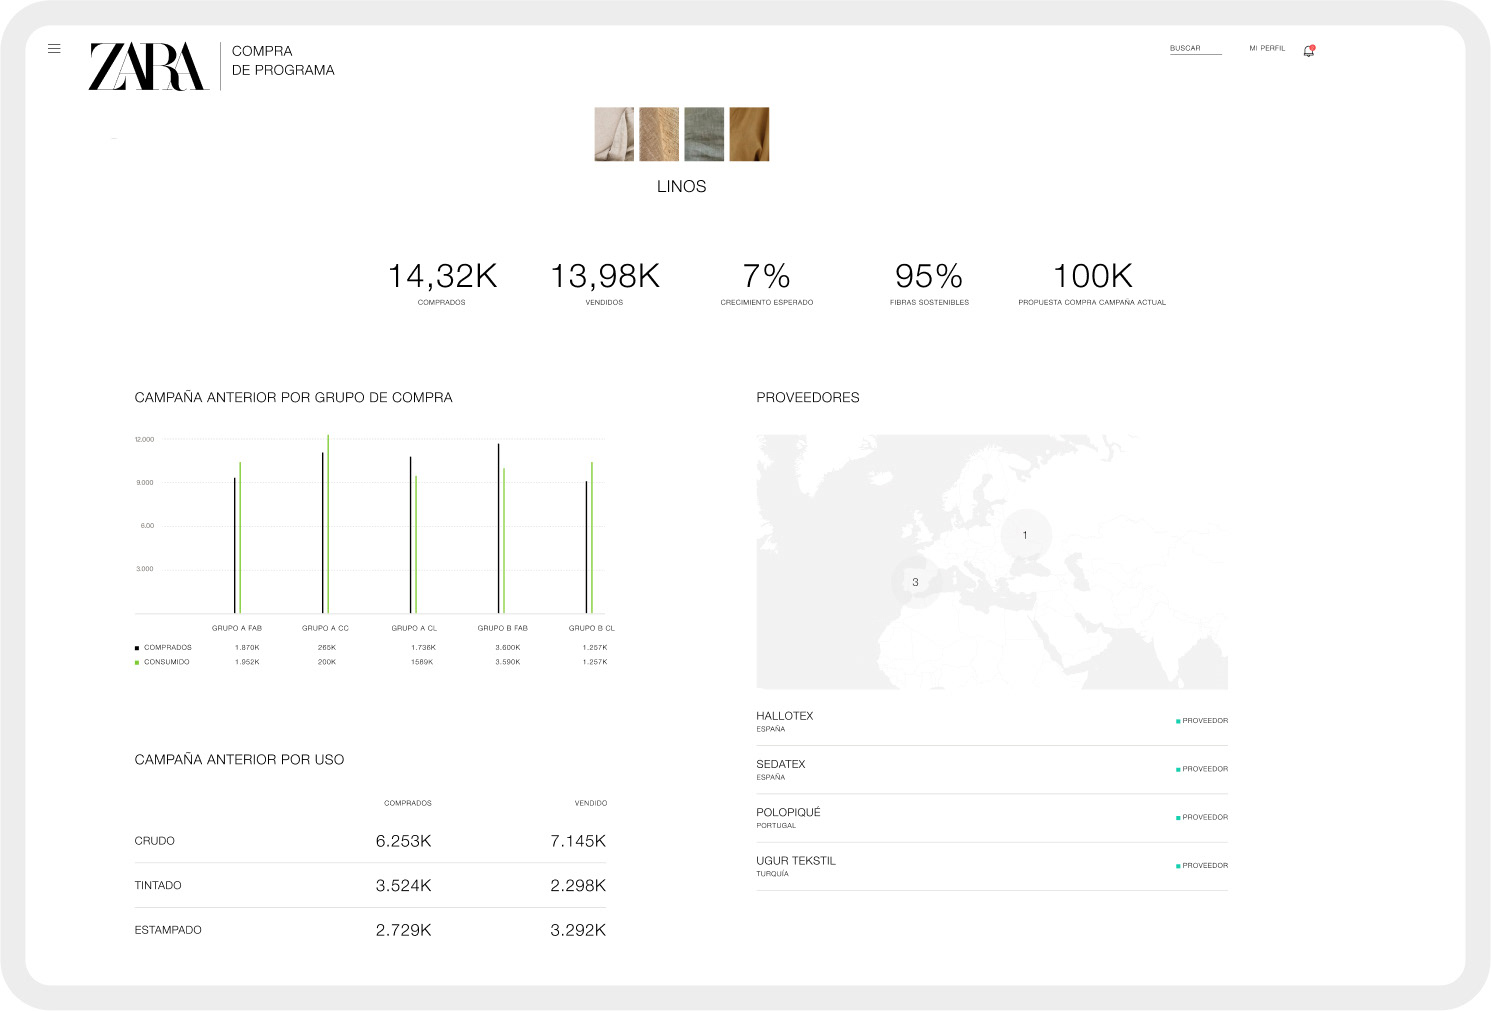
Created prototypes of our data products to demonstrate the integration of design system elements within Power BI.
Design Decisions
Choose design solutions that balance the constraints of Power BI with the aesthetics and functionality of the ITX Design System
06
Testing
Usability Testing
Conducted usability tests with internal stakeholders to evaluate the effectiveness and usability of the new style guide.
Feedback
Collected and analysed feedback, identifying areas for improvement and ensuring the style guide met the needs of all users.
Iterations
Iterated on the design based on feedback, refining the style guide to better serve the intended purpose.
07
Final Solution
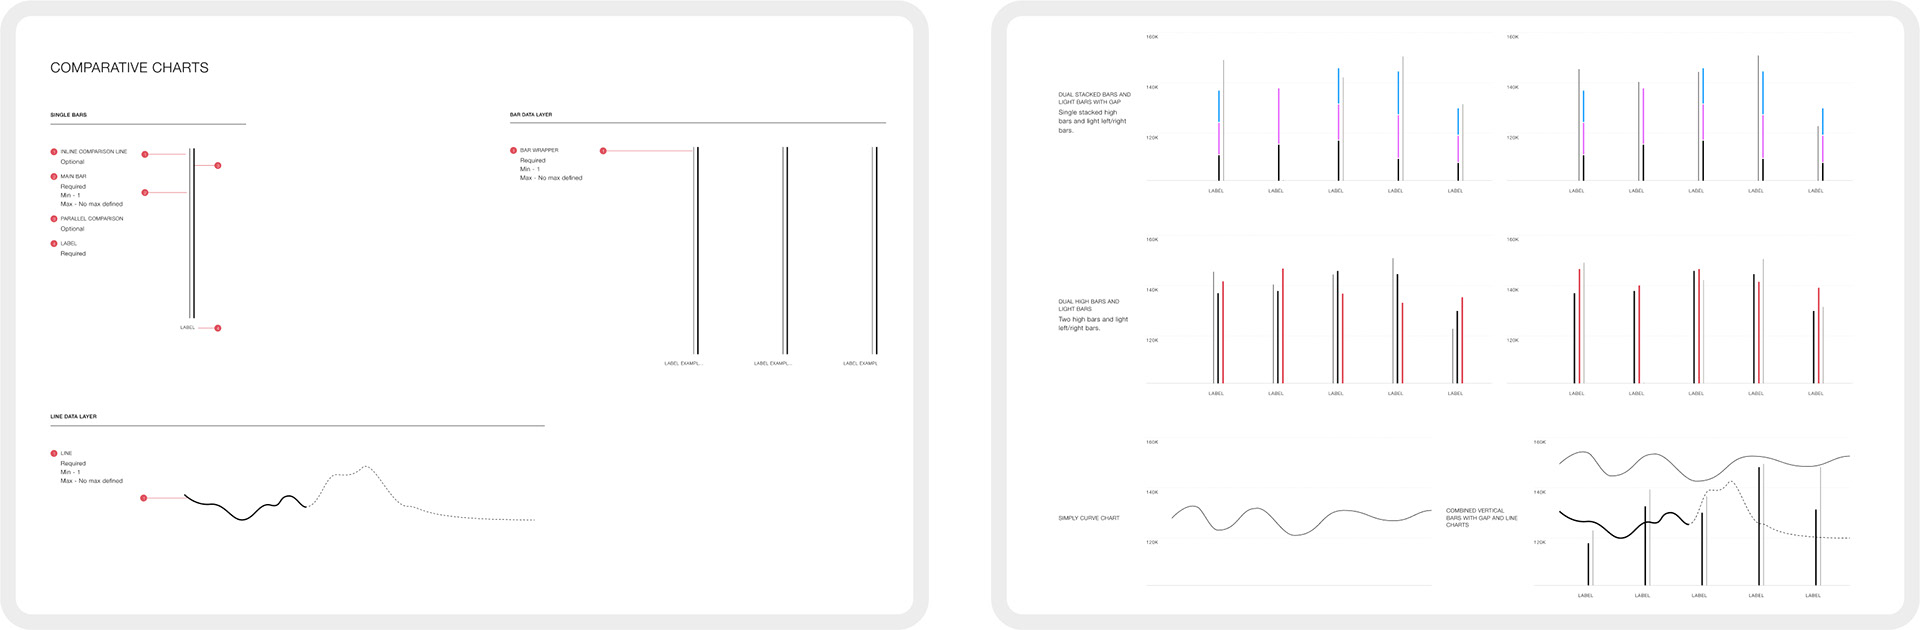
Final Design
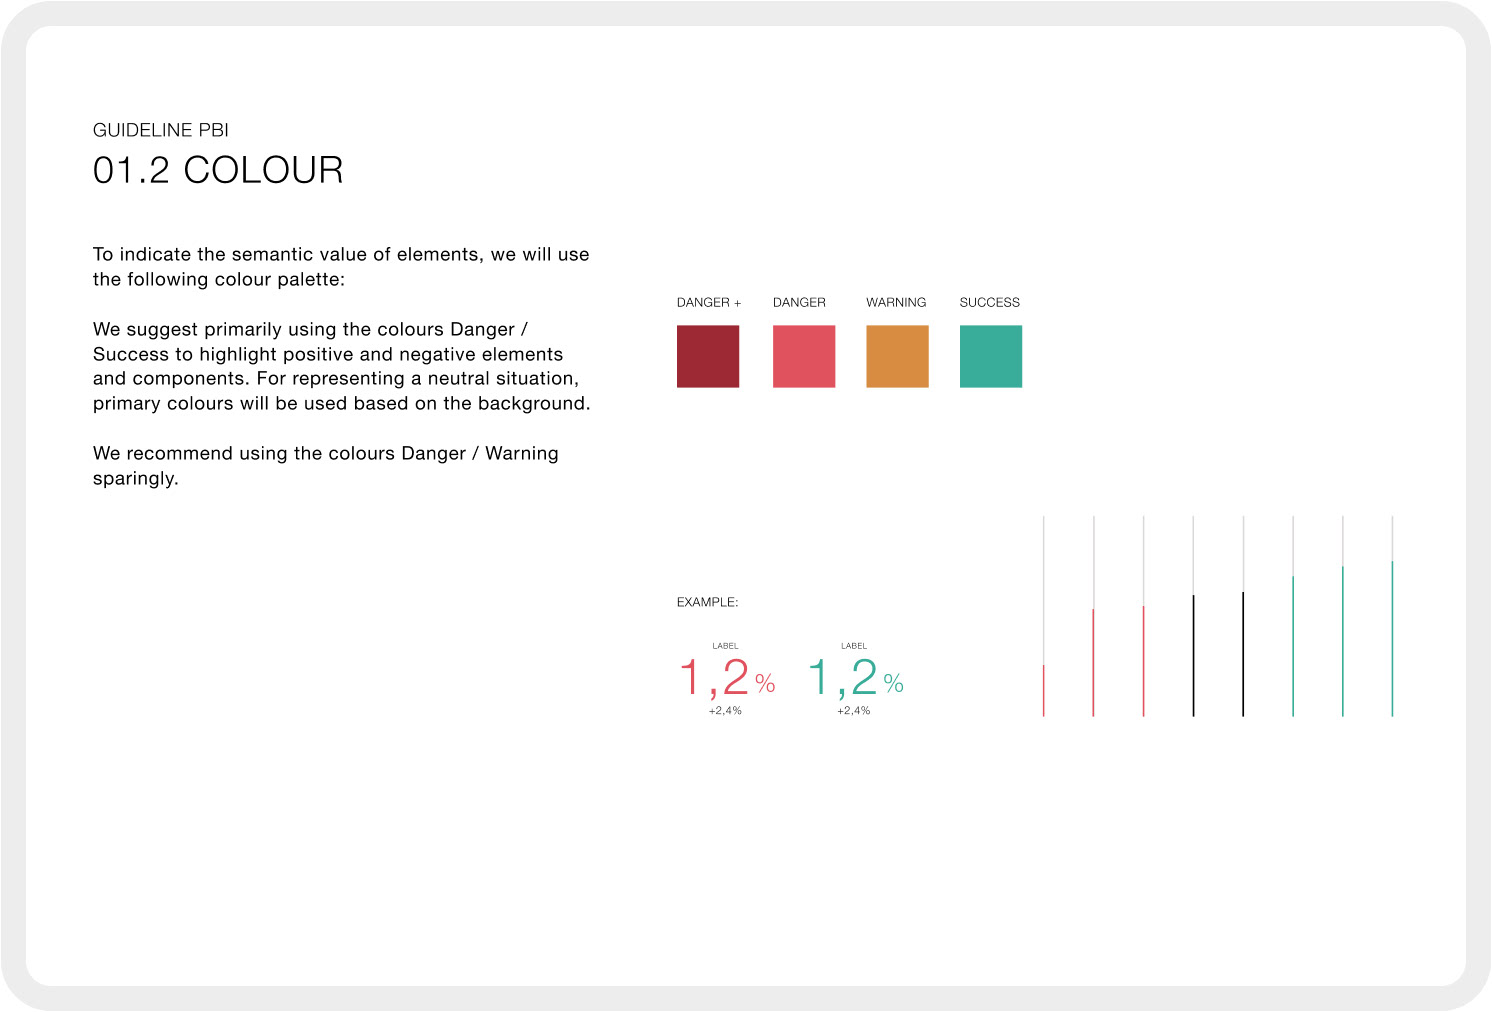
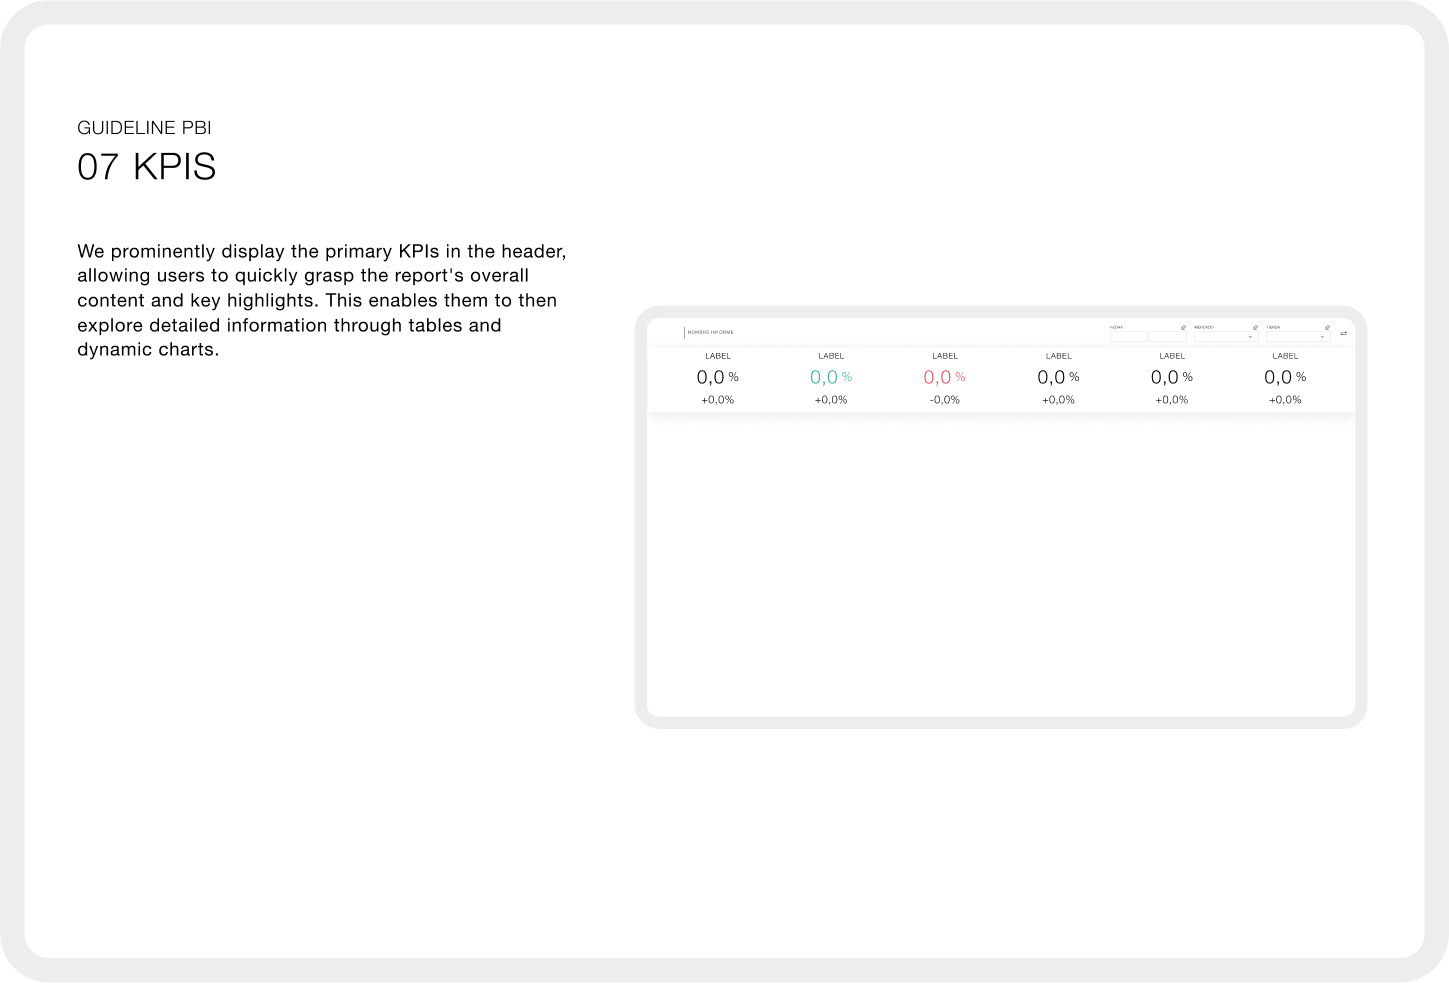
Presented the final style guide, including detailed components and guidelines for using the design system within Power BI.
Figma Components
Created a comprehensive Figma file with all components tailored for Power BI.
Exportable Guidelines
Developed guidelines in a user-friendly format for stakeholders less familiar with Figma.
08
Results
Conclusion
Successfully harmonized the design system with Power BI, enhancing visual consistency and improving workflow efficiency between tech and design teams. The guide and components will be used to create the design for all data products using Power BI at ITX.
Learnings
Gained valuable experience in creating adaptable design solutions within corporate constraints and collaborating across multidisciplinary teams.